
Practical Data for Nonprofits Part 4 — Data is Meaningless
Well maybe not actually meaningless, but it isn’t The Source of Truth that many believe it to be. At least not without some context.

When you stare into the abyss, and the abyss stares back. Image of a black cat in a cat cozy, with just the eyes visible, attributed to an unknown internet genius.
We all make the context that makes the meaning
Most of the nonprofits I work with are obsessed with data-driven decision-making. It makes them feel objective. They point to the numbers from their reports and feel justified in whatever decision they’re making, unaware that they are almost certainly demonstrating some level of confirmation bias that is exacerbated by their electronic systems. Many people feel that you can’t argue with the data.
Unfortunately, “The data says…” is not a valid statement. The data says nothing. Data is not information — we make it into information by telling stories that give it context. A report is nothing more than a story we are telling about data we collected — data that someone already decided was important. We can’t report on what we don’t collect, of course, but how often do we examine the underlying assumptions in what we do collect, to see if the story still makes sense?
There is no inherent meaning in the data you store in a database or spreadsheets. The meaning is created by how you join that data together, how you package and present it on the screen, and how you program the interactions.
Data is not Truth, and it is not objective
Whether you use a database or spreadsheets to be “data-driven,” there is no inherent meaning in the data you’re storing. A word or a number is just a word or a number, no matter how it’s stored. The meaning is created by how you join data together, how you package and present it on the screen, and how you program the interactions.
Whether you have custom code or an off-the-shelf database, some group of humans, somewhere, made assumptions about how you were going to use their product and then built a bridge between what you interact with (user interface) and the way the data has to be stored (data store, database). You are already having your data translated for you every time you interact with it, before you even try to put your own interpretation on it.
So what? The group of humans building the bridge will make the obvious decisions and do the right thing, and your interpretation will align perfectly with theirs, right?
Not everything that is obvious to you is apparent to others, particularly when you get into the details necessary for programming business logic.
In my workshops, I like to present an exercise that I modified from a comparative literary theory class (shout out to the liberal arts! and Dr. Uzzie Cannon, thank you for the memorable lessons). I’ll give you a few points of data, and you write down the obvious meaning — the first thing that comes to mind. It’s important to write it down so you can’t cheat later.
Ready? Here’s the data:
Cup
Bat
Bar
Frame
Now make all those words into a sentence. Did your definition of each word change when the context changed? Did you realise one of those words is the most important word, without which the others would make no sense? Or perhaps the interaction between two words was really the key, their proximity giving the entire sentence its meaning.
It’s a lot of fun to have people share their words and see what they manage with their sentences. Which of these “obvious” associations did you come up with?
Cup
teacup, tumbler, other drinking vessel
trophy, like the Stanley cup
part of an intimate part of clothing
an act, as in to cup something with your hands
Bar
a physical object like a bar of gold or bars on the window
your local pub
to ban someone
without, as in ‘bar none’
Bat
a flying mammal
a thing used to hit another thing, like a baseball or cricket bat
a verb used to describe the hitting of one thing with another
Frame
a thing you put around a picture or a window
to falsely imply someone has committed a crime (“I was framed”)
to contextualize
Or, of course, something else entirely.
Most of us navigate our day by “knowing” what “everybody knows.” It’s an informal system that works startlingly well. In most of daily life, we don’t need to be very precise, and humans are amazingly good at adapting to new information.
Culture shock happens when what “everybody knows” is now suddenly very different from what you know, and you find yourself less able to navigate the world. In a way, interacting with computerized systems is a type of culture shock. Humans evolve our understandings over time, and we adapt based on the present context. If you defined “cup” as a drinking vessel a minute ago, it doesn’t impair your ability to define “cup” in all the other different ways as the need arises. You don’t even notice you’re doing it. But a computer can’t evolve in that way.

Programmers have to be maddeningly, alarmingly formal and precise about data and its definitions.
They have to construct rules that work all the time. They have to store basic elements — words and numbers mostly — but then reliably assemble it back into meaning. Largely, when a programmer is defining “cup” it will stay defined in that one way, because so many different interactions are assumed and often codified based on the core definition.
If they’re programming for drinking vessels they are going to create functions for putting drinkable liquid in the vessel, a variety of ways to drink from it, and so on. In fact, since what you picture as a tea cup and what I picture as a tea cup can differ, a programmer often has to do the equivalent of drawing a picture of this exact tea cup that has these exact dimensions. It isn’t enough to agree it’s a drinking vessel. In so doing, they have set context for how you interpret your data, whether you ever know what that context is or not.
You don’t have to know the details of the underlying context in your data systems, but you do need to know that they’re there. If you insist on definitions that don’t match the underlying data system’s definitions (and the data system can’t easily adapt) then the story you tell from your data will be based around a complete misunderstanding. You’ll be telling a story about a winged creature that eats insects at night based on statistics from baseball’s most famous sluggers.
A model for understanding how we understand data
Many years ago, I got to attend a lecture by the late Jay Forrester, who said that “data” can be represented as:
the mental data base — what is inside of people’s heads, all of the knowledge and stories and suppositions and context and insight and emotion and glorious messy humanness
the written data base — the fraction of stuff that humans have been able to write down, housed in the internet, in libraries, ledgers, and so on
the numeric data base — the fraction of the written data base that can be turned into numbers, from which most of our modern research is drawn.
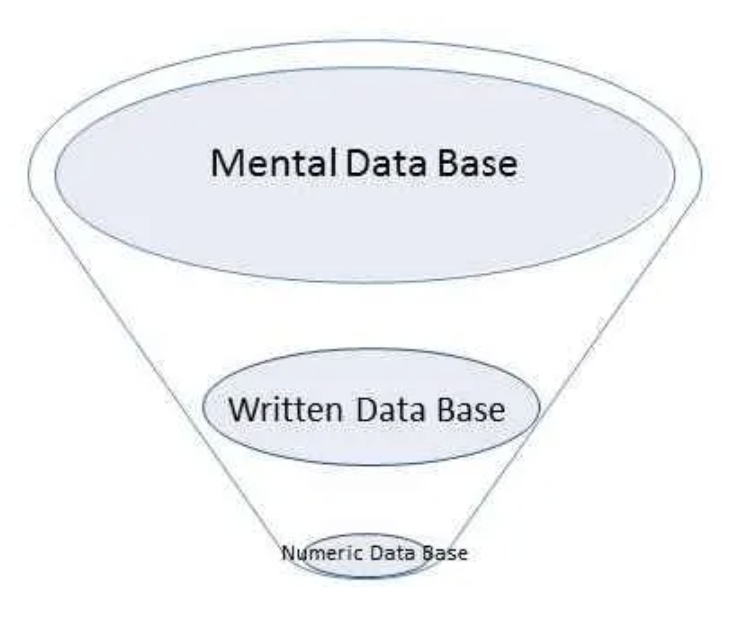
Jay Forrester’s Representation of Data
Each higher layer is at least an order of magnitude more populated with information than the layer beneath, such that our mental database contains a richness that can’t be approximated at this time by all of literature and written knowledge, which in turn dwarfs anything we can draw from the numeric data systems of the present day:
With a minor modification and apologies to Professor Forrester, this model illustrates exactly how our reliance on, and misunderstanding of, numeric data systems (or what most people know as “computers” and “databases”) imposes a significant limit on our understanding of the world. I modified his diagram to help make this point clearer.
With data systems, what is visible to us is only a tiny fraction of what is possible to know.
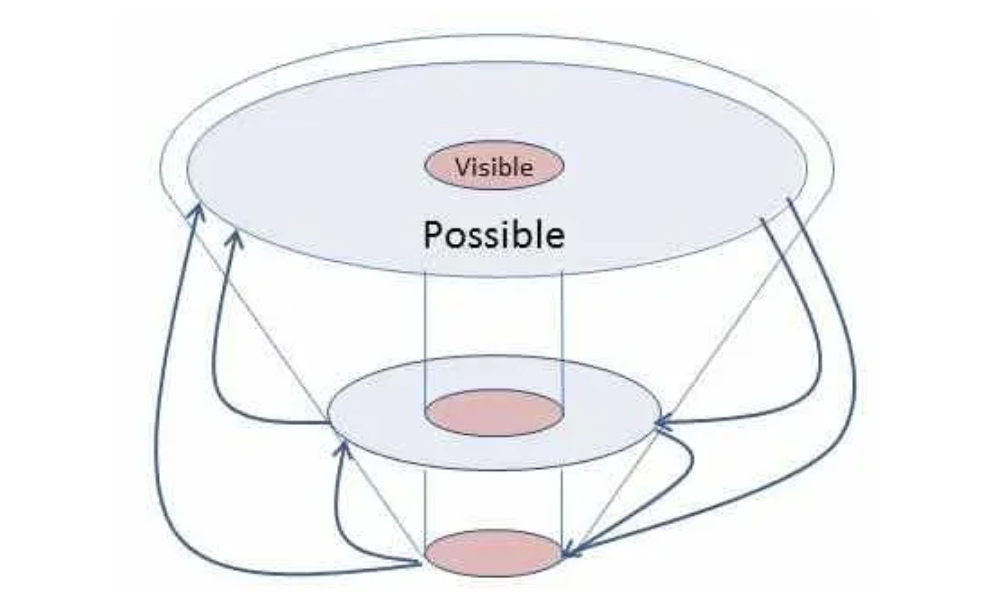
Reading from top (the mental database) to bottom (the numeric database) tells the story of how data systems are created.
We begin with the complexity of the human mind — and in an organizational setting, the even greater complexity of many human minds striving toward a common goal
Then we narrow it into what can be written into policies, procedures, definitions, and other codified practices.
We use these rules to further narrow all that might be into what can be stored in a binary fashion, in accordance with the policies, procedures, definitions, and codified practices, so that we can measure and monitor and report on them.
Naturally, what is stored in a data system is a tiny fraction of reality that has already been through sometimes thousands of iterations of decisions about what to keep and how to interpret data on its way in to storage. And yes, even the biggest of “big data” is subject to this initial winnowing.
Reading from bottom to top of this diagram is how we make data-driven decisions. We begin with an already narrowed set of information that has filtered through our bewildering array of cognitive biases, organizational rules, practices, and folklore to be stored as relatively contextless 1s and 0s somewhere in the cloud. To extract them, we have to largely perform the process in reverse: we begin with data elements, then filter them back through rules, policies, and procedures (which have likely shifted since the original encoding was done), and finally use our vast mental storehouse of connections, heuristics, and biases to interpret the results.
What does it all mean, if it’s meaningless?
We often believe we are operating with The Truth when we make decisions based on data. In fact, we are simply operating with the end result of a process of chopping reality up into really tiny pieces, and trying to agree on how to glue those pieces back together again so they make a convincing photo.
And:
Data, like any set of facts, is helpful and can be used to inform productive changes when it’s understood within its context.
Sure, the actual programming may be someone else’s job. And you may have someone you rely on to get reports. As a leader, you help define the norms and standards for data in your organization.
You can double-check that your assumptions are the organization’s assumptions, and that whoever is working with data knows those assumptions.
You can always seek to understand the context of the data you are using to drive your decisions.
You can foster a culture of data literacy to help people understand the context for the key data you collect and report on.
When you understand that a translation is needed for any digital system you work with, no matter how ‘intuitive’ it seems, you bring a superpower into your organization. Instead of letting your digital systems dictate your processes and reporting and waste your time, you can now start to use them as tools to help your organization get its work done.
This article is part of a series on data literacy for nonprofit leaders. Its goal is to share terms and concepts that aid in making good technology decisions when you’re not a technology expert (or even if you’re a little bit tech-phobic).
See the overview here.
Next up: Different flavors of reporting